
The term ‘monsoon’ is almost synonymous with tropical meteorology in part because countries which lay within the tropics/subtropics can be highly impacted by rainfall during a monsoon season. There is often a misconception of what monsoon rainfall is with thoughts of very intense and abrupt rainfall often associated. In fact in its purest form a monsoon is simply where the majority or annual rainfall occurs during one (sometimes two) seasons and should no longer be associated with a seasonal reversal of wind which is an artefact of previous research but no longer accurate for reasons we shall touch on later. So in other words outside of the monsoon season very little rainfall occurs and the climate is generally dry. The origin of the word monsoon derives from a Arabic “mausim”, translated as “season”, again pointing to the seasonal nature of monsoonal rainfall.
In the tropics, an increase in precipitation is projected by the end of the 21st century in the Asian monsoon and the southern part of the West African monsoon with some decreases in the Sahel in northern summer (Cook and Vizy, 2006).
A further misconception arises in consideration of the monsoon season itself which is often thought to only occur during the Northern (June-September) and Southern (November-February) hemisphere ‘summer’. However, there are also ‘winter’ season monsoons which impact different regions globally (see figure 1).
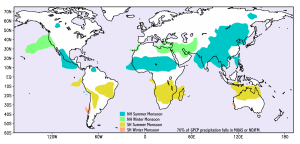 Figure 1: Regions where at least 70% of annual precipitation occurs in the 5-month seasons indicated.This is only one of many possible definitions of monsoon regimes around the globe. Data are from GPCP version 2.5 For 1979-2008 provided by P. Dirmeyer.
If we consider Figure 1 and the Southern Hemisphere summer monsoon in South America and only considered a monsoons being defined as a seasonal reversal of wind then such an index would show no monsoons over South America. This is because the South American monsoon does not have a traditional reversal of wind direction between summer and winter seasons. This by no means should discount the importance of changes in circulation (e.g. wind reversal) as specific monsoon regions such as India or S.E. Asia have monsoon systems which vary because perturbations in the monsoon circulation which can have an impact on the monsoon strength. This starts to show that monsoon systems are not the same globally and can be highly complex respond to many different local and teleconnected phenomenon (teleconnections is a linkage between weather and climate phenomena in geographic regions separated from one another) which can have dissimilar impacts on different monsoon regions.
How are monsoons formed?
At a very simple level we have described a ‘monsoon’ as a highly seasonal distribution in precipitation which caused a distinct ‘wet’ and ‘dry’ season. Different monsoon regions will respond differently to various phenomena partly due to their geographic location, topographic characteristics, and sensitivity to different modes of variability of certain region or global teleconnections (e.g. El Niño–Southern Oscillation (ENSO)) which will have dissimilar (or no) impacts of different monsoon regions.
Perhaps the most important atmospheric phenomenon that is common in all monsoon regions is the Inter-tropical Convergence Zone (ITCZ). The ITCZ is a zone of convergence which leads to the formation of a belt of low pressure systems that encompasses the tropics globally that brings sustained (sometimes intense) rainfall. This belt of surface convergence is formed as part of the ascending branch of the Hadley circulation, a large-sale atmospheric circulatory system where air rises at the equator through the troposphere and flows flows towards the higher latitudes (~40 degree’s north and south) gaining an easterly flow (due to the conservation of angular momentum and the corriolis force (a phenomenon driven by the rotation of the Earth) forming the subtropical jets. This mass advection of air then descends to the near surface returning back towards the equator with a westerly flow (again, thanks to out friend the corriolis force) as what is known as the ‘trade winds’ completing the loop. But why is this important? Throughout the year the ITCZ is not static, it moves both north and south across the equator. For instance, during June-September when the Asian sub-continent experiences its monsoon season the ITCZ can be found ~25°N. While during the Southern hemispheric summer (December-January) the ITCZ can reach the southern portions of the African continent and Northern Australia (~25°N). As a very simplified model this variability in the north-south march of the ITCZ through the year generally follows the location of the thermal equator. This is a band encircling the world having the highest surface temperatures due to having the highest incident solar radiation (you receive more indictment radiation at the equator than the higher latitudes due to the earth being a sphere. Thus regions furthest away from the equator receive less solar radiation due to greater tilt paralleled to the incoming solar radiation). However it is not that simple, if one were to view a map of the ITCZ location through the year you would see that it varies substantially geographically (see figure 2).
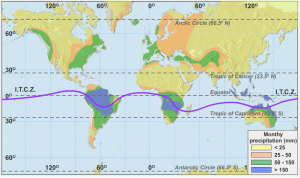
Figure 2: Maximum southerly extent of the ITCZ (purple line) during the southern hemisphere summer (December-February. Monthly precipitation (mm) is is contoured.
If the planet was a water world the location would follow a nice straight east-west line. But as can be seen from figure 2 the ITCZ deviates substantially along the east-west trajectory. The general trajectory shows that when the ITCZ is over water it is nearer the equator away from the thermal equator. Over land the ITCZ is further south of the equator. This land-sea difference in the location is driven by the different heat capacities that’s these twp properties have. Essentially land heats up faster than the ocean, so when the thermal equator is directly over the land surface it will respond quicker and heat up compared to the ocean. Due to the heat retention and stability of temperature within the ocean the ITCZ remains more anchored to one position over oceans. This complex relationship is further compounded when you take into account other atmospheric and oceanic circulatory phenomenon which are redistributing energy to different places. Further, changes in land surface types and/or altitudes, meaning different land and ocean basins respond differently to energy fluxes, can reduce/enhance surface temperatures altering the location (and intensity) or the ITCZ. In Tropical Monsoon Climates the ITCZ can interact with other climatic patterns that form as a result of deep lows over land. In combination with the ITCZ this helps produce enormous seasonal rainfall.
Wind reversal, as mentioned earlier, is also a fairly common phenomenon characteristic of most monsoon regions (except the North and South American monsoons). These regions experience a literal reversal in wind by ~140°, changing from a offshore advection of near surface wind during the respective hemispheric ‘winter’ to an onshore advection of near surface wind in the respective hemispheric ‘summer’. As the thermal equator lays over the ocean surface this incident solar energy evaporates (and crucially transferred) vast amounts of moisture into the overlaying atmospheric airmass. This flows onshore, releasing latent heat causing the airmass to become more bouyant (hot air rises) than the surrounding air, releasing further energy as it condenses causing rising further and eventually precipitating. But why does this reversal occur?
Figure 3: Simple model showing the simple wind reversal mechanism and varying heat capacities of the land and ocean during the winter and summer leading to the different temperature and thus the resulting pressure differentials and resultant wind patterns.
Figure 3 presents a simple model depicting the mechanism leading to the ~140° change in wind direction in monsoon regions between the winter to summer season. As mentioned earlier the land and ocean have different heat capacities, i.e. the amount of energy required to change the temperature of a substance by 1°C. Land has a lower heat capacity meaning it will respond quickly to incident solar radiation and heat up quickly. The ocean has a correspondingly higher heat capacity and thus takes much longer to heat up meaning in the summer the land surface will be much warmer than the surrounding ocean which is colder (top panel figure 3). In the winter time this situation reverses as the land surface is further away from the thermal equator now, however the ocean has retained allot of that summertime heat which is slowly releases during the winter making it warmer than the surrounding land surface. The differences in temperature between the land surface and the ocean creates a temperature and thus, pressure differential. Air will generally flow from high pressure (colder surface) to low pressure (warmer surface) leading to this observed wind reversal. As always different factors can modify the strength of this flow. For instance, if we consider the S.E. Asian monsoon system the flux of moisture from the ocean to land is enhanced due to the Tibetan plateau (TP). This is because this large-broad topographic feature sits much higher (~5.5km) in the atmosphere than land at sea level. The TP heats up the surrounding airmass much more than would normally occur at the altitude without its presence creating an even stronger temperature and pressure gradient and thus, an enhancement of the monsoon circulation and a greater flux of moisture onshore. Similarly the Himalaya further play an important role as a topographic barrier to dry Continental Asian airmasses especially into the Indian sub-continent which allows tropical airmasses laden with moisture to advect much further north to the steps of the Himalaya (subsequently also responsible for the dry climate leeward of the Himalayas).
Various atmospheric jets (e.g. subtropical jet, tropical easterly jet, African easterly jet, Somali jet, etc…) also play an important role in determining the strength of a monsoon. These jets can be a product of different regional and global atmospheric and oceanic interactions which are not necessarily related to the monsoon system. Perturbations to these jets (both location and intensity) can have an impact on the monsoon (intra-seasonally, inter-annually and potentially inter-decadally variability). For instance a strong Tropical Easterly Jet (TEJ) is strongly correlated with a strong Asian monsoon. However, the impact can be more complex, some research has shown that a weaker TEJ maybe more conducive for stronger tropical cyclones in the Indian ocean due to weaker easterly shear. This might suggest that overall the monsoon weakens however extremes in storm activity could increase. The subtropical jet is also another important jet feature, particularly for the Asian monsoons system. Generally this mid-tropospheric westerly flowing wind is south of the Himalaya, due to the height of the Himalaya, however during the monsoon season this jet ‘jumps’ northward signalling the start of the monsoon in India as tropical airmasses advect further north. This a very abrupt shift and is caused by the increasing heating on the TP, causing a low pressure system to form and strengthen to a point where it is effectively pulled north over the Himalayas.
Teleconnections:
Although seemingly disconnected weather and climate around the world in one place can be strongly influenced by phenomena many thousands of km’s away. In general the atmosphere is the main linking mechanism where changes in the ‘normal’ climate regime can be manifested. For instance large-scale, quasi-stationary Rossby wave (an atmospheric undulating wave) can lead to a region having hotter and/or wetter conditions, yet downstream and half a wavelength away the conditions can be drier and/or cooler than the ‘normal’ global pattern.
- Indian Ocean dipole (IOD) – The IOD involves an aperiodic oscillation of sea-surface temperatures, between “positive”, “neutral” and “negative” phases. A positive phase sees greater-than-average sea-surface temperatures and greater precipitation in the western Indian Ocean region, with a corresponding cooling of waters in the eastern Indian Ocean. In the summer following a positive (negative) phase in the IOD (transmitted through the subsurface dipole signature which remains long after the surface feature has already dissipated from the year before) leads to an intensification (reduction) of the South Asian High (SAH) and greater (lesser) eastward extent of the eastern ridge and an associated westward extending shift in the enhanced (weakened) western Pacific subtropical High leading to a weaker (stronger) monsoon.
- El Niño-Southern Oscillation(ENSO) – During an El Niño event with anomalously high sea surface temperature (SST) over the eastern tropical Pacific, convection in the western Pacific shifts to the central and eastern Pacific, which then suppresses the convection in the Asian monsoon region as well as the western Pacific warm pool region, resulting in monsoon failure. There has been some suggestion that this relationship may have stalled due to increasing global temperature over the last 30-years. Recent work points that the greenhouse warming disconnects the Indian walker circulation from ENSO (but not over East Asia). Warmer spring and winter interior Asian continent temperatures reduce snow cover enhancing the land-sea temperature contrast and the monsoon circulation offsetting the negative impact of El Niño. However this may be a result of natural variability leaving an open debate as to the relationship of ENSO in a warmer world. One that paleoclimate scientists may shed more light on.
- North Atlantic Oscillation (NAO) – Changes in the position of the North Atlantic storm tracks and transient eddy activity associated with the positive (negative) NAO phase contribute downstream to negative (positive) sea level pressure anomalies in northeastern East Asia. In negative NAO years, a stationary wave pattern is excited from the southern NAO centre over northwestern Europe to northeastern East Asia. However, during positive NAO years, a stationary wave pattern is excited extending from the NAO centre across the central Eurasian continent at around 40°N and downstream to the southeast. This may explain a connection between the positive NAO and atmospheric circulation in middle and southeastern China and the drought conditions in the north and northeastern of the country over the last two decades.
There is however much uncertainty when it comes to understanding the impact of teleconnections and the mechanisms which link them to monsoon systems and inevitably more work is needed in part to the high signal to noise ratio and a lack of robust spatiotemporal observational data.
Future of monsoons:
Currently, there is still much debate with regards to how monsoons will change in the future in terms of the magnitude of change and even the sign of change with many models not always agreeing. This can be dependant on the monsoon region itself due to the complex dynamic and thermodynamic interactions and teleconnections which will also evolve (and have their own uncertainties) under greenhouse gas forcing through the 21st century, however some regions show greater consensus than others. In a simple model of a warming world Sea Surface Temperatures (SST) should increase strengthening the meridional temperature gradient with the adjacent land surface allowing greater flux of evaporated moisture from the ocean to land from a strengthened monsoons circulation. However in a warmer world the higher latitudes (extratropics) are more sensitive and warm up faster than the lower latitudes (tropics). This reduces the pole to equator temperature gradient weakening the large-scale atmospheric circulation. However different rates of warming between the southern and northern hemisphere is suggested to in-turn strengthen the Hadley circulation. Again uncertainty in the response of not only the monsoon circulation but the large-scale circulation under warming conditions. Further, as the world warms humidity and precipitable water scale with Clausius-Clapeyron at 6.5% per K increase over the oceans. Precipitation also scales more slowly however at about 2% per K in models (thus a increase in monsoon precipitation in theory). However the repercussion of this is a weakening of vertical temperature gradients and the mass flux from the boundary layer to the free troposphere further weakening large-scale convection.
In general the IPCC AR4 report suggested that precipitation would intensify (figure 4) by ~5-10% however this was not consistent for every monsoon region (e.g. Africa/South America where there is little consensus between models in the sign of change (white regions in figure 5)) nor spatial coherence in an individual monsoon basin (e.g. S.E. Asia).
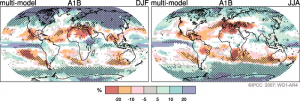
Figure 5: IPCC AR4 report. Relative changes in precipitation (in percent) for the period 2090–2099, relative to 1980–1999. Values are multi-model averages based on the SRES A1B scenario for December to February (left) and June to August (right). White areas are where less than 66% of the models agree in the sign of the change and stippled areas are where more than 90% of the models agree in the sign of the change.
The disagreement in the multi-model mean (the average climatology of all the models used in the IPCC) is down to many models not being able to predict the basic state of the monsoon which has hampered many older models (although not all, cref. HadCM3). This is why it is critically important to properly evaluate a model when preforming analysis on monsoons. By the time AR5 was released significant progress had been made with more models showing agreement in the sign of change (figure 6), again wetter, but instead measure the change relative to natural variability. Even at RCP8.5 scenario the increase in precipitation is within one standard deviation of natural variability of the multi-model mean for most monsoon regions (with the exception of India by the turn of the century. No monsoon regions with the exception of the Austra-Asian monsoon by the end of the 22nd centruy indicate the ‘stippled’ regions in figure 6 which indicate regions where the change in precipitation greater than natural variability with >90% of models agreeing in the sign of change.
Figure 6: IPCC AR5 – Multi-model CMIP5 average percentage change in seasonal mean precipitation relative to the reference period 1986–2005 averaged over the periods 2045–2065, 2081–2100 and 2181–2200 under the RCP8.5 forcing scenario. Hatching indicates regions where the multi-model mean change is less than one standard deviation of internal variability. Stippling indicates regions where the multi-model mean change is greater than two standard deviations of internal variability and where at least 90% of models agree on the sign of change.
Furthermore long-term observations of the monsoon are scant and spatially inconsistent globally, particularly over the oceans. Historical analysis of changes in the global monsoon have show an actual decrease until the 1980’s where it has subsequently stabilised and started to increase. Uncertainty in the response of the monsoon may be a result of decadal variability or more simply a lack of spatio-temporal data converge in the monsoon over the observational record. A confusing signal of change is presented based on past and present and future reports as to what exactly the response of monsoon systems will be in the future.
Paleoclimate:
Paleoclimate data may provide some important insights into the long-term behaviour of monsoons, especially under warmer conditions that were prevalent in the past, for instance such as in the Pliocene warm period, often use an an analogue for your own future. However difficulty arises due to the lack of proxy-data the further back in time you go to not only evaluate the monsoon but the wider global climate signal itself.
There are many potential uncertainties when trying to model past climate such as:
- The continental configuration based on spreading and collision rates of different tectonic plates
- Orographic uplift rates and weathering rates – the height as we know today of the Himalaya and Tibetan plateau plays an important role for the onset and evolutioin of the Indian and S.E. Asian monsoons.
- Opening and closure of oceanic gateways – this can potential have an impact of regional (maybe even global) monsoons systems through modifying the amount of energy and momentum that is transported to various places around the globe.
- Atmospheric green house gas concentrations – The amount of important constituent gases, such as CO2, has changed considerably through time. How these have evolved may have an impact on the monsoon system either directly (i.e. Clausius-Clapeyron) or indirectly (i..e modification of oceanic and atmospheric transport).
- Ice coverage – Ice sheets have not always existed throughout the northern and southern hemisphere. Their height and extent have waxed and waned through the last ~35 million years. Regional and global atmospheric and ocean temperatures can be significantly modified by them and as such potentially certain monsoon systems.
- Vegetation – climate feedbacks – Vegetation has also evolved significantly through time with certain time periods favouring certain species that can cope with the overriding climate. Vegetation can both respond to changes in climate but also modify the overlaying climate itself. These complex land surface-atmospheric interactions can potentially lead to feedbacks which could directly or indirectly modify the monsoon.

