This page will highlight some of the recent novel modelling concepts we are using to try and better understand the behaviour of the climate system through the past. In this project we are using many different modelling techniques to unpick the complex relationships between certain processes and past tectonic configurations that led to the establishment, evolution and intensification of the East Asian monsoon system. This is important for investigation of the biodiversity ‘hot-spot’ in the South of China and Asia which is home to one of the highest concentrations of bio-diverse species found globally of which many and only unique to this specific region.
One major innovation of this project is the creation of comparatively much higher resolution simulations of paleoclimates. The Paleo-modelling group at the University of Bristol have been applying computing modelling of future, present and in particular past environments to better understand the behaviour of the Earth system and its complex relationships. To do this we use computer models that simulate these known complex relationships to deep-time climates, such as the Rupelian (in the Oligocene), some ~31 million years ago. Below we show one of the new models that has been specifically developed for this project incorporating much higher spatial resolution than previously used in paleocliamte modelling studies.
Here we show an animation of the weather (each day is shown) during a typical year in East Asia between in the modern day and the Rupelian. This first animation shows the precipitation signal produced from the high resolution model and you can really see the difference between the typical types of storms system and intensity in precipitation throughout the year between these two very different time periods.
HighRes Precip animation
Description
Here we take a satellite eye view of cloud formation in this same time frame.
HighRes Cloud animation
Description
As clouds are airmasses of differing moisture content they will follow the dominant air trajectory. But how different is the atmospheric circulation ~31 Million years ago compared to today?
HighRes Wind animation
Description
Lastly let’s see what the surface air temperature is telling us about how hot it is getting in East Asia in the Rupelian. Was the past hotter than today? Did past climate suffer more heat stress?
HighRes Temp animation
Description
This is just a sample of some of the modelling work that is currently being conducted. This is just one typical time frame we are investigation and for the project as a whole we are also simulating not just the Rupelian, but every single geological stage (19 in total) through the Cenozoic, That is from 0 Million years ago (today) to 66 million years ago, just after the Dinosaurs had become extinct. Each one of these geological stage simulations is being run at both high (as shown above) and low resolution but also we are utilising an isotope enabled climate model to understand how the isotopic composition (oxygen and deuterium) changed and evolved in the atmosphere and ocean. this will help us answer questions about changes in topographic elevation, in particular in the important Tibetan Plateau region whose tectonic evolution has played a fundamental role in shaping the climate system in the past to the present day.
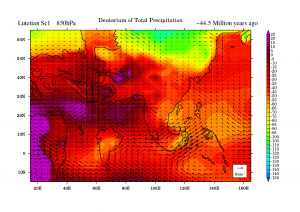
Figure 1: Deuterium isotopes during JJA in the Lutetian (~44 Million years ago) with 850 hPa winds shown.
These model simulation can take many months to run on the supercomputers at the University of Bristol. But the information they are producing will allow a step change in our understanding of the evolution of climate and complex interactions that have taken place. This will allow us to better inform future climate change through better understanding of the behaviour of the climate system in warmer worlds of the past where future IPCC predictions are suggesting we are heading towards.

